Python Analyst |Developer | Django Expert

Projects Completed: 1333
Ratings: ★★★★★ 4.9/5
Sample Project Using Python For Data AnalysisI am an experienced Python data analyst with a passion for transforming your raw data into actionable insights. My expertise spans from Python libraries like Pandas, Numpy, Matplotlib, Seaborn, Pytorch, and Django, to any other Python library you may need.
Using Python for data analysis, I will help you create interactive dashboards, do excellent machine learning projects, statistical analysis, web development, data mining, data cleaning, predictive and financial analysis, time series analysis, and any other analysis project you may need.
For the last 6 years, I have completed more than 1300 projects for different clients all of them being a success. Let’s Collaborate and harness the power of Python for data analysis to help us make sound decisions.
A Sample Project Using Python for Data Analysis
A researcher wants to know the trend of student attendance at school from 2019 to 2022. He collects data from different districts in the USA and places the students in different categories. Based on that data, he wants to answer different questions.
- What is the trend of school attendance across different districts in the USA from 2019-2022?
- Does the social, economic, or physical status of the student affect the attendance rate?
- Can the data be used to predict the attendance rate for the year 2023 and next year?
A Sample Solution of the Project
The Trend of School Attendance from 2019 – 2022
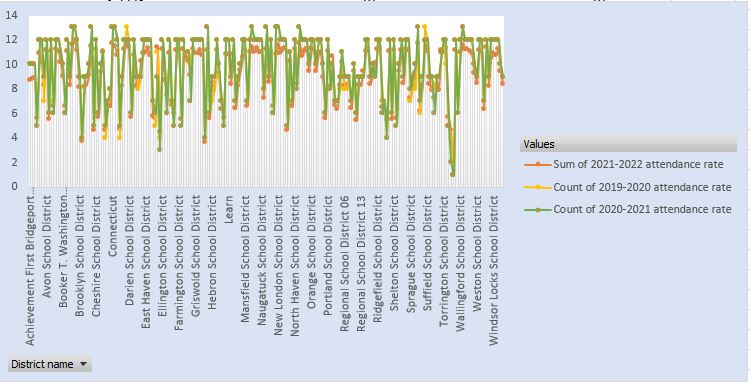
To evaluate the school attendance trend across the USA districts from 2019 – 2022, a line chart was used. Noting from the trend, it is evident that the three years had almost similar attendance rates across all the districts. However, across the districts, the attendance trend was not stable.
Does the social, economic, or physical status of the student affect the attendance rate?
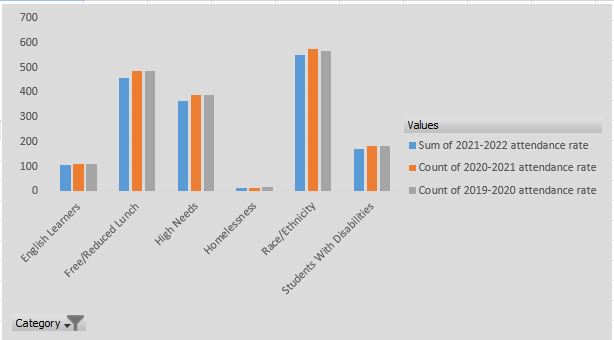
The social, economic, and physical status of students significantly affect school attendance. For example, homeless students who can be thought to be the least on the economic radar have the lowest attendance rate.
As well, English Learners have a low attendance rate followed by students with disability. Nevertheless, Race and ethnicity seem not to impact attendance. Free lunch or reduced lunch however seems to attract more students thus increasing the attendance rate over the years.
Predictive Analysis for Student Attendance using 2020 -2022 Attendance Rate Data.
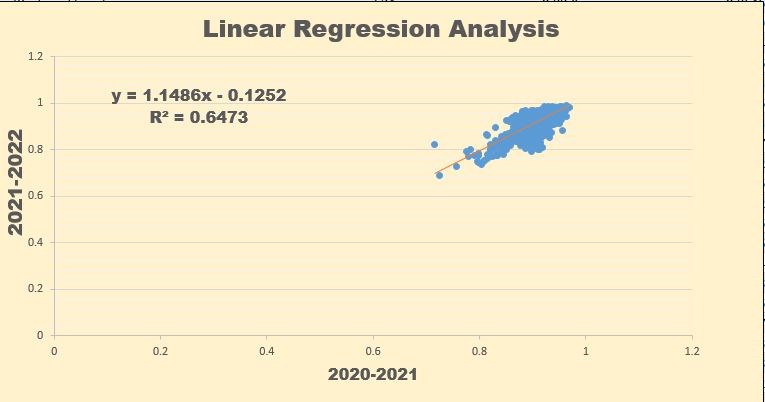
To develop a predictive model for the next year’s attendance, the 2021 and 2022 data were used. Linear regression analysis was done. First, a scatter plot was plotted to evaluate if there was any significant linear relationship. Based on the visual, there was a significant linear relationship.
Further analysis was done to ascertain the claims. Based on the R2 value, (0.65), the model was strong enough to predict attendance rate. As such, the model was developed.
Y = 1.1486 X – 0.1252
Python for Data Analysis Increasing Demand
Python data analysis capabilities are unmatched. Being a versatile language, python has made it easy to do large data analysis.
Its libraries like Pandas, Numpy, Matplotlib, SciPy, Django, and Sklearn have made data processing, manipulation, visualization, and statistical analysis simple.
Also, the syntax of Python is very easy which makes it ideal to be used for data analysis as it can perform complex analysis with vast amounts of data.
Reasons Which Make Python for Data Analysis Most Preferable in the Industry and Research
- Rapid Prototyping: Python for data analysis adopts a simple expressive syntax that makes data analysts write concise code thus enabling the prototyping of ideas.
- The Strong Community Support: Any analyst who has used Python for data analysis will tell you the Python community is just one click away from solving your challenge. May it be a machine learning challenge, financial analysis, visualization, predictive analysis, statistical analysis, or time series analysis, the community is always available to help you navigate any challenges.
- Easy to Use: Using Python for data analysis doesn’t need you to use any compiler for your code. This makes it easy to write and run code.
Industries Where Python Is Widely Used for Data Analysis
- Technology: Python’s versatility allows people in tech space to develop data analysis and data science cutting-edge solutions in a short period.
- Data Science: The capability of Python when used for data analysis makes it the most preferred software by data scientists to extract large sets of data and get insights.
- Healthcare: Python is used for developing predictive models in the healthcare industry.
- E-commerce: E-commerce collects vast amounts of data. Python is one of the powerful tools which can be used to analyze large sets of data, it is used in the industry for analysis.
What Can I Do Using Python?
Python is a diverse language. First, you can use it for data analysis. This includes doing statistical analysis, machine learning, financial analysis, visualization, and any other type of analysis you may need.
Also, you can use Python for robot development, web development, data mining, spatial analysis, game development, and NLP.
Python can also be used for chatbot development and it is also widely used in the cyber security field.
People Also Ask
How Is Python Used for Data Analysis?
Python comprises different libraries which you can use for data analysis. The widely used libraries include; Pandas, Numpy, Sklearn, Matplotlib, Seaborn, and Pytorch. Its simple syntax for data analysis makes it easy to understand.
Can I learn Data Analysis with Python?
Yes, many online platforms offer certifications in data analysis using Python. Approximately, you need six months to master data analysis using Python. You can also look for a private tutor at afroresearch.com to help you master data analysis with Python easily.
Which Python is best for Data analysis?
Pandas is the best library for data analysis using Python. However, for data visualization, you can opt for Matplotlib or Seaborn. A combination of the three is a powerful pack for any data scientist or analyst.
Is Python and SQL a good combination for data analysis?
Yes, python and SQL are a powerful combination for data analysis. SQL helps you structure your data and query it while Python will help you with data analysis and cleaning.
Which is easier Python or SQL?
I would honestly tell you none of them is easy. You need persistence and serious commitment to master either of them. Also, both SQL and Python serve different purposes and therefore, it is hard to figure out which one is easy compared to the other.
AfroResearch Inc. Python for Data Analysis Services
AfroResearch Inc. is an organization that connects prospective clients with experienced data analysis from the USA and UK. through the site, you can hire a machine learning engineer, data analyst, data visualization expert, financial analyst, market research analyst, and any other type of analysis you may need.
Connecting with them is simple. Visit the site and Live chat with our support team to get connected to an expert to help you.