SPSS Data Analysis Help | Analyst | Data Consultant

Projects Completed: 1301
Ratings: ★★★★★ 4.9/5
View a Sample of my SPSS data Analysis ProjectAre you struggling with SPSS data analysis? You are not alone; many people like you face challenges navigating the SPSS software. However, don’t worry, that is where I come in.
For the last 6 + years, I have offered expert SPSS help to many clients and successfully helped them achieve their goals. I am a freelance SPSS expert ready to take that data and give you understandable information maybe it be in the research context or for business analysis.
I will help you with statistical analysis, data visualization, financial analysis, SPSS data coding, ANOVA, ANCOVA, survey analysis, Correlation and regression, Chi-square analysis, t-tests, and any other expert SPSS help you may need.
Let’s collaborate now and take the analysis burden from you.
How Long Will the SPSS Data Analysis Service Take?
The time it takes to complete your project depends on different factors and also the SPSS specialist's availability. The scope of the project, complexity, and data volume are among those factors. However, you will discuss with the expert and agree on the delivery time.
How Do You Charge for Your Expert SPSS Help?
Similar to deadlines, the charges for your SPSS project depend on the project scope, complexity, urgency, and data volume. The SPSS expert will be flexible, and you will discuss with him about the charges and mode of payment.
Will My Project Be Customized to Meet My Needs?
Yes, all your projects are customized by our experts to meet your needs. You first discuss with the expert about the project and how you want it to be done. In case you want to change anything later, you will get that service for free.
Will I Get Continuous Updates on My SPSS Project?
You can ask for your SPSS project update anytime you need. Our freelance SPSS experts are always available through the live chat to give you updates. You only need to text them on your private portal, and you get any update you need.
What Do I Need to Provide for the SPSS Data Analysis Project to Be Completed?
To complete the project, you need to provide the data or the source of the data and the instructions for the project. Any other resources needed for the project completion, you will discuss with the expert.
Analyzing the Growing Demand for SPSS Data Analysis Online

IBM SPSS software is an analysis tool developed and managed by the IBM company. This statistical package was initially developed for social sciences but it has evolved to be used in general data analysis. You can get the software directly from the IBM company.
Research shows that around 85% of scholars carry out quantitative and qualitative data analysis and among them, 32% use the SPSS software for analysis. This is because SPSS has a user-friendly interface and it is easy to use.
The Key Features of the IBM SPSS Software Package
This software has unique features that serve different purposes:
- Statistical package for quantitative data analysis
- Modeler program for predictive analysis
- Text analysis feature for deriving insights from qualitative data
- Visualization designer for visualizing data using different visuals
Why Has the Demand for SPSS Statistical Analysis Grown Over the Recent Years?
First, the demand for data analysis, including SPSS specialists, is based on the fact that technology has made data available and easily accessible. Data is everywhere in the current tech space. Big data, structured and unstructured data, is available. Each organization wants to leverage the availability of data to their advantage.
However, despite the availability of data, we don’t have many experts, and this cuts across to even the SPSS experts. Also, the majority of data experts have opted to offer their services online, and that is the reason it is easy to get a freelance SPSS expert online.
SPSS data analysis is mostly preferred because the software is easy to use, readily available, and mostly operates similarly to the Excel software which many people are familiar with.
Types of Analysis You Can Do Using SPSS Software
Whether you are leveraging the skills of an SPSS specialist or doing the analysis yourself, there are many types of analysis you can do using the SPSS software.
We can categorize the analysis into; data preparation, statistical analysis, interpretation, and visualization.
The most common statistical data analysis that you can do on SPSS include;
- Descriptive statistics: Descriptive statistics are used to summarize a given data set. They are broken down into measures of central tendency and measures of variability. Among the measures of central tendency include; mean, mode, and median, while the measures of variability include; variance, minimum, maximum, and range.
- Parametric analysis: This SPSS data analysis type focuses on making assumptions of parameters for a given population distribution.
- Non-parametric analysis: It is an analysis type that is used for data that doesn’t meet the requirements of parametric analysis.
- Data visualization: Data visualization is a way of summarizing data using graphs and charts.
How Do You Outsource Your SPSS Project to a Specialist Online?
Though there are many freelance SPSS experts online, not all of them will give you excellent results. As such, you must be aware of the SPSS expert you are engaging.
- Experience: Make sure the SPSS data analysis expert you are engaging has experience on similar projects.
- Availability: As we said earlier, the demand for data analysis is high and the experts are a few. Therefore, when searching for expert SPSS help, make sure you inquire about the availability of the specialist you are engaging.
- Technical expertise: An SPSS specialist should be well-versed in all the technical aspects of the software. To evaluate this, you can ask the expert for previous projects which he has done using SPSS.
- Excellent communication: Make sure the experts communicate the progress of the project for you to check if it is going well.
- Delivery time: You must agree with the expert about the time of delivering your project to ensure that it doesn’t get late and you mess up your programs.
A Sample of My SPSS Data Analysis Project
Case Study: A client wants to venture into the automotive business. His focus is to start selling all automobiles globally. However, before he makes the final decision on his business, he wants some data analysis to help in decision-making. Here are the things the client wants to understand.
- How are the sales in the automotive industry, which ones sell better?
- Which months have the highest sales and which ones have the lowest sales?
- Which countries can one make more sales?
This client has contacted me to help him with data analysis and at least respond to these questions using the SPSS software.
A Sample Solution of the SPSS Data Analysis Project
How are the Sales in the Automotive Industry, which ones sell better?
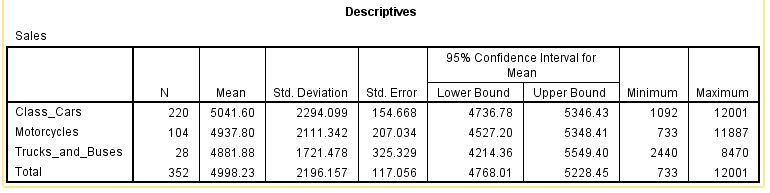
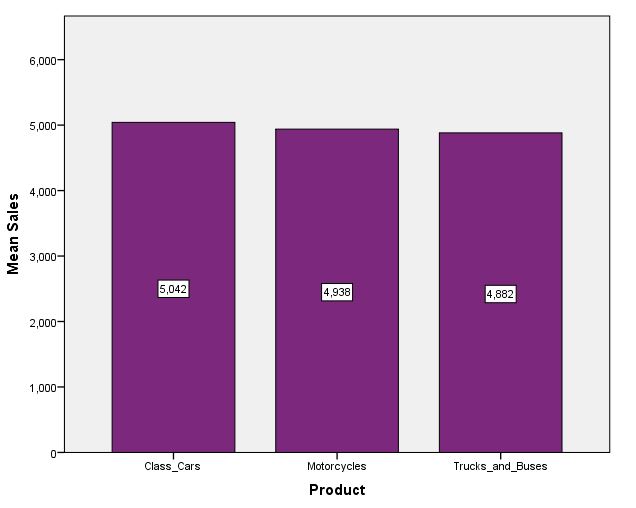
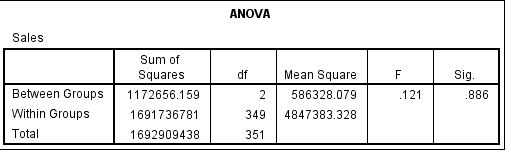
To evaluate the sales trends in the automotive industry, descriptive analysis, visualization, and one-way ANOVA were conducted. The descriptive analysis reveals that the sales were almost the same with just a slight difference (Class cars = 5042 average sales, Motorcycles = 4938 sales, and Trucks_and_buses = 4882). Since there was no clear distinction in the sales, further analysis (ANOVA) was performed to evaluate if there was any statistically significant mean difference in the sales.
Tested at a 95% confidence interval, the results showed there was no statistically significant mean difference between the sales of Class cars, Motorcycles, and Trucks_and_buses; F (2, 349) = 0.12, P = 0.886.
Which Months Have the Highest Sales and Which Ones Have the Lowest Sales?
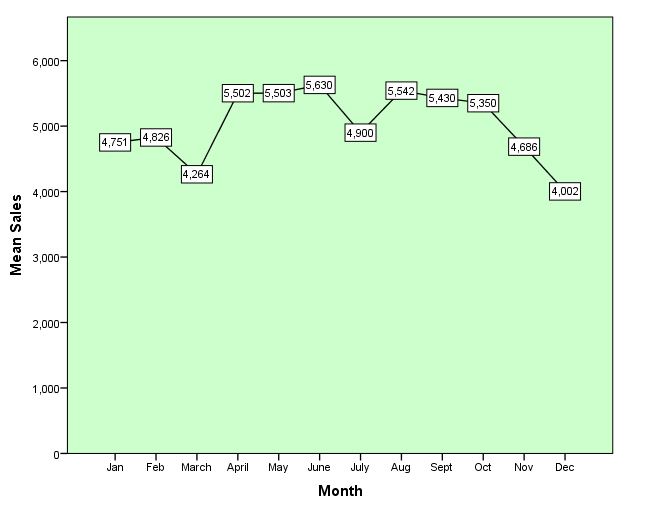
June has the highest sales per year while December seems to have the lowest sales overall. Noting from the trend, April, May, and June seem to have the highest sales trend, then the sales decline in July and rise again in August. From September, there is a sharp sales decline until December.
Which Countries Can One Make More Sales?
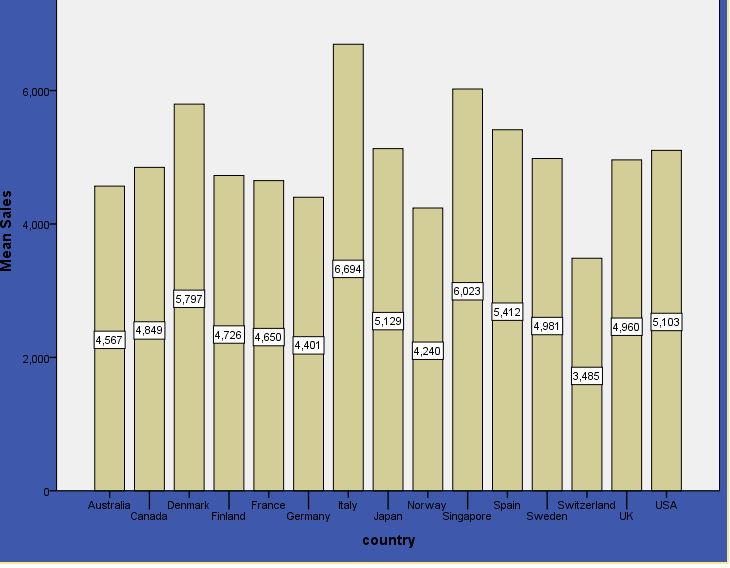
Italy has the highest sales while Switzerland has the lowest sales rate. However, on average, the sales trends across countries seem to be high.
Recommendations
- The selection of the country to invest for business should be based on other factors and not sales distribution. This is because the overall sales seem to be high in each country.
- Also, the product sales seem similar overall. Therefore, the investment should be done for either specific products or your product of preference, but a decision should not be based on sales since all products are almost selling at the same volume.
- As well, though December seems to have the lowest sales, and April the highest sales, overall, the sales are high across the months. Therefore, the investor should not worry more about making low sales in specific months.