IBM SPSS Specialist

Projects Completed: 1300
Ratings: ★★★★★ 4.9/5
Sample SPSS Data Analysis ProjectI am Dorcas, your go-to expert when it comes to IBM SPSS software. With a strong academic background in statistics and certification from IBM for SPSS, I am your trusted authority to help you.
I will help you navigate all areas of SPSS software with ease. My package includes but is not limited to SPSS data coding, ANOVA, ANCOVA, Correlation and regression, Chi-square, Parametric and non-parametric analysis, statistical analysis, inferential analysis, visualization, data interpretation and report writing, and any other help you may need using SPSS.
What sets me apart is my ability to deliver results that are both accurate and meaningful. My analyses will assist you in making sound decisions.
Whether you are conducting research, working on a thesis, or analyzing business data, I will simplify the complexities, ensuring that you make the most out of your research.
A Sample SPSS Data Analysis Project
Case Study: A businessman wants to venture into the electronic market. He wants to focus on some specific electronics like televisions, home theaters, etc. Before he ventures into the business, he has hired you as an SPSS expert to help him make informed decisions regarding the business. You have a data file with different variables which you will use for the same. Help the businessman make logical decisions.
Questions to help the businessman
- On average, how many units per product are sold per month?
- Which Region has the highest sales regardless of the product?
- How are the sales revenue based on product and region?
- Is there a sales relationship between the products based on regions?
Sample Solution
Descriptive statistics showing the product units sold per month
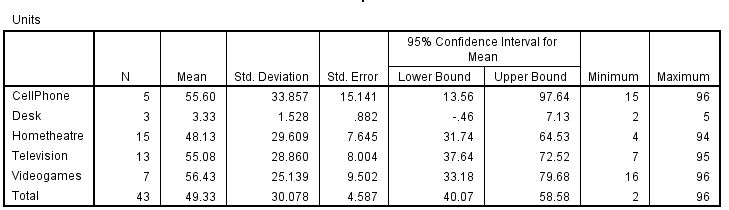
Based on the descriptive analysis, Video Games have the highest number of sold units per month (M = 55) while Desk has the least (M = 3). Others with high sales volume include; cell phones (M = 55), and Televisions (M = 55).
Which Region has the Highest Sales Regardless of the product?
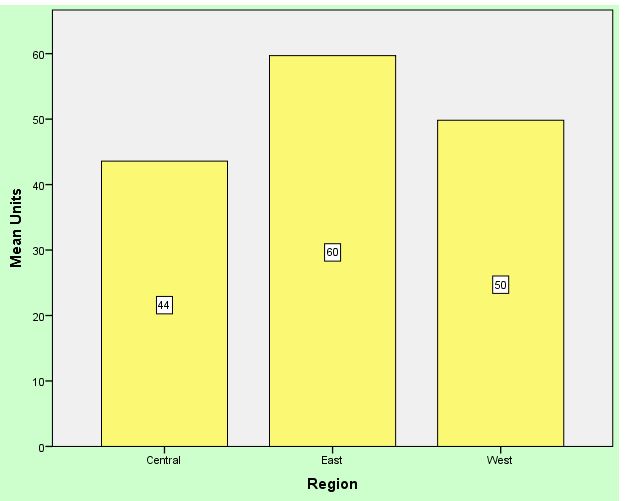
The East Region has the highest sales units per month standing at 60 while the central region has the least sales units standing at 44 per month.
How are the sales revenue based on region and product?
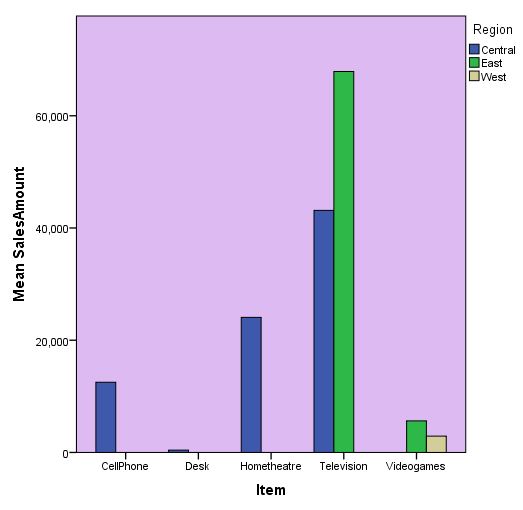
Television is the highly sold product in the central and East regions. Also, home theatre has relatively high sales in the central region. Desk is the least sold product in all regions.
Is there any relationship between the products based on region?
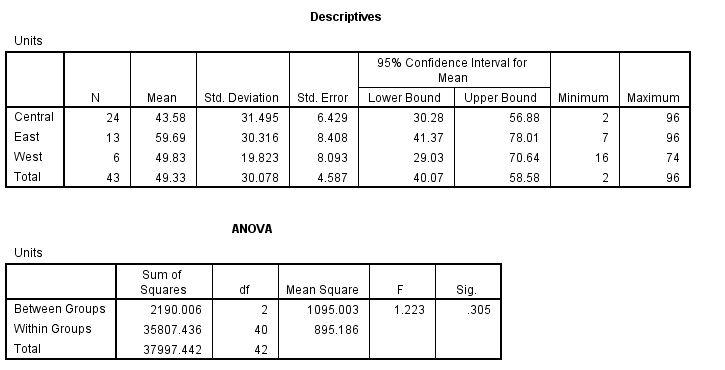
To evaluate if there is any relationship in terms of product sales based on regions, one-way ANOVA was done. Based on the results tested at 95% CI, there was no statistically significant mean difference in sales based on regions F (2, 40) = 1.22, P = 0.305. This means relatively, all the regions (East, Central, West) produced almost the same amount of sales per month.