Excel Data Analyst |Financial Analyst | Business Consultant

Projects Completed: 1320
Ratings: ★★★★★ 4.9/5
View a Sample of my Excel Analysis ProjectI am Simon, an experienced data analyst, and a financial consultant. For the last 6 years, I have helped more than 1300 clients with different projects among them being Excel data analysis projects.
I will help you in the following areas; descriptive analysis using Excel, financial analysis, data sorting and filtering, pivot tables and pivot charts, what – if excel analysis, regression analysis, data visualization and dashboards, solver, conditional formatting, text analysis, statistical analysis, time series analysis, scenario manager, database analysis, and Power Query and Power Pivot analysis.
Expect quality work, timely delivery, excellent communication, and unlimited revisions to customize your project to your liking.
How long will it take to complete my project if I use your Excel Data Analysis Services?
The time to complete your project depends on many factors like scope of the project, complexity, and data volume. However, you agree with the expert on the deadline and they keep it.
Do you Revise the projects to meet client customization needs?
Yes, if you use us for Excel data analysis services, you are entitled to unlimited revisions until the project is customized to your liking.
How do you price your Excel data analysis Services?
Our prices are pocket-friendly. Mostly, experts will charge you $15 /hr. However, you can also agree on the cost based on the project.
What resources do I need to provide for you to complete the data analysis project?
Mostly, you need to give the expert your data or where he should mine it. Then you give him your objectives and any other instructions you may have.
Will I get periodic updates for my project if need to check the progress?
Yes, you will get periodic updates on the project's progress in your private portal. You can also live chat with the expert on the private portal and ask for a progress report.
The Demand for Excel Data Analysis Services Online and how to get the best Service
The demand for Excel data analysis services has gone high in recent years. Coursera an online learning platform presents SQL, python, Excel software, and R-statistics as the top most in-demand data analysis software packages currently.
Excel is a powerful tool that enables researchers, organizations, and data analysts to manipulate large data sets with ease. However, since not everybody is a data analyst, the majority of people turn online to seek data analysis help. There are many experts who offer such help including Excel data analysis services
By just doing a simple Google search, you can get experts to help you with financial analysis, statistical analysis, data visualization, data sorting, pivot tables, data filtering and cleaning, and descriptive analysis. All these analyses are part of the packages offered by different organizations that offer Excel data analysis services.
Why is Excel Data Analysis important?
Leveraging your data and using Excel data analysis services, you will have an upper hand in decision-making for your business and research. Here are some of the reasons why Excel data analysis is important.
- Better customer segmentation and targeting: Due to advancements in technology, businesses nowadays use data analysis to help them target the right customer base and develop logical marketing plans. Among the widely used services is Excel data analysis since it is simple yet powerful.
- Reduction of Operation Costs: Leveraging the Excel data analysis services you can figure out which areas in your business need more resources and money.
- Better problem-solving ways: Excel data analysis will help you make informed decisions to solve all the challenges facing your business.
Skills Needed to Make an Excel Data Analyst Competent
When you are seeking Excel data analysis services, the competency of the expert defines your project's success. You need to ensure that the expert has technical and soft skills which are important for any analyst. Here are the most common skills you need to check;
Technical Skills
- Basic Excel functions: The expert must be familiar with basic Excel functions like SUM, Average, Count, Min, and Max. Also, he should know the logic of functions like IF, AND, and OR.
- Data cleaning and transformation techniques: Data cleaning techniques like removing duplicates, handling missing values, and text manipulation are important for any Excel analyst.
- Data validation: The expert offering the Excel data analysis services should be able to set validation rules to control the type and range of data entered into cells.
- Charts and graphs: Data visualization using charts and graphs is important for data summarization. Also, using Sparklines for in-cell charts.
- Data analysis tool pack: This is the most important since it is the one that is used for statistical analysis.
Soft Skills: Excellent communication, teamwork, critical thinking, problem-solving skills, time management skills.
How to Develop Your Project before Seeking Excel Data Analysis Services Online?
Though the expert plays a crucial role in helping you with your project, you equally play an important role in helping him understand your goals. Here are the things you need to include in your project for discussion with the expert.
- The Project objectives and goals
- The scope and time frame of the project
- Source of data
- Budget of the project (leave it open for discussion)
- Deliverables based on specific times during the project process
Where Can I Get Excel Data Analysis Services Online?
As discussed earlier, the demand for Excel data analysis has increased over the years. As well, service providers have also increased in equal measure. Many reputable experts online offer Excel data analysis services to prospective clients like you. However, based on my experience, here are some of the best places to get excellent services for a friendly price.
- AfroResearch Inc.: This is the current leading online platform for Excel data analysis services. Comprising experts from the USA, UK, and Ireland, the site connects you with an expert based on your project’s needs. It has served many clients for the last 11 years. You can check their reviews online before engaging with the site experts.
- Fiverr: This is another reputable online platform that connects you with experts for Excel data analysis. Here you talk with the expert directly.
- Upwork: I have not used this platform myself, but I have seen their recommendations online and it seems to be a good site.
Though there are many online sites, these are the most popular ones and the highest-rated online.
A Sample Excel Data Analysis Project
Case Study: Our client wants to open a store and sell Apple products. However, before this, he wants to have a clue about the sales performance of the products based on secondary data. He has contracted an expert from AfroResearch Inc., to help with product research and give a simple report which he will use as a guide. The following are the things the client would like to know before venturing into the business.
- What product has the highest revenue across the regions and which one has the lowest revenue?
- Regardless of the product, which region has the highest sales?
- What is the trend of sales across the months?
- What is the profitability of the products?
We did data mining and got some Excel data files online with recent Apple product data. The following is the analysis to help our client make informed decisions.
Solution of the Excel Data Analysis Case Study
A snippet of the data file.
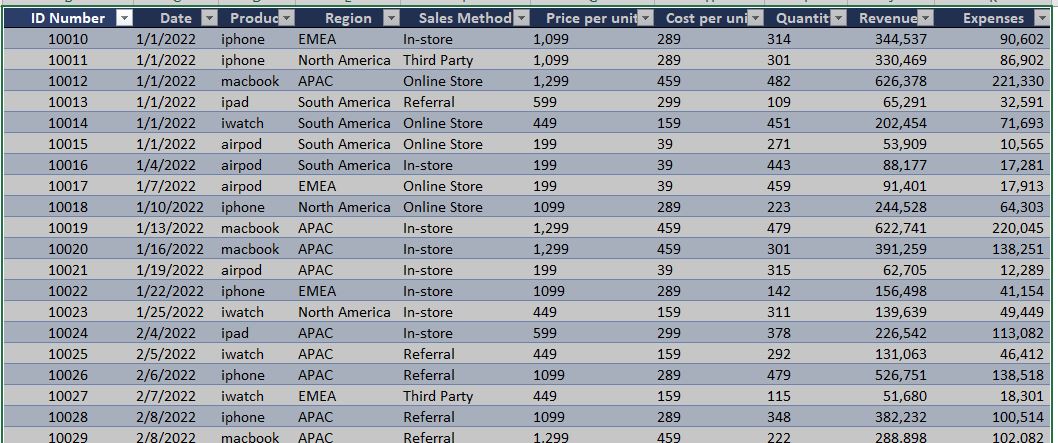
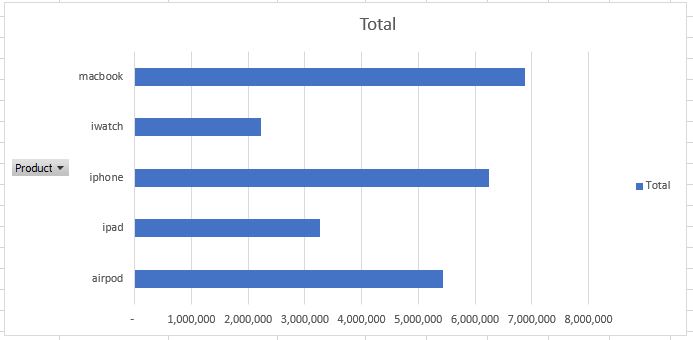
Products Revenue Across Regions
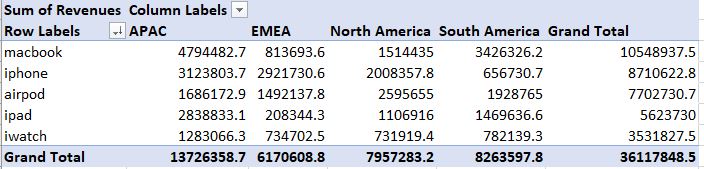
Across the regions, MacBook has the highest revenue while the iWatch has the lowest revenue respectively. iPhone and AirPod have almost similar revenue on average.
Distribution of Sales Across Regions
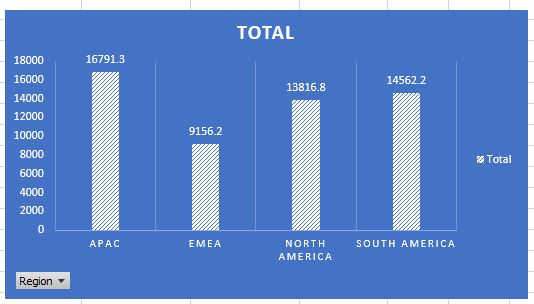
Based on the total sales of all products, the APAC region has the highest sales while the EMEA region has the least sales. North America and South America have relatively similar average sales.
The Trend of Sales Across the Twelve Months
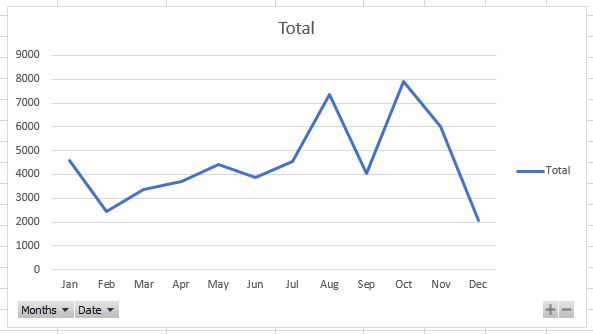
Apple products seem to have the highest sales in October across the regions while the least sales are recorded in December. There is an increased sales trend from February to May which goes down in the month of June but picks up again in July up to August.
Profit Distribution of the Products Across Regions
MacBook is the most profitable product across the regions while iWatch is the least profitable. iPhone and AirPod have moderate profits, while the iPad is not highly profitable.
Recommendations
Based on the analysis, MacBook seems to have the highest sales, highest profit margins, and highest revenue. Therefore, it should be the first product for consideration in the store.
APAC region has the highest sales, and thus, setting up a store in that region is an ideal idea. The store should be highly stocked in October and least stocked in December since the highest sales and lowest sales are recorded in those months respectively.
The most profitable product is the MacBook, followed by iPhone and AirPod, and therefore, they should be the first products to be stocked in the store.