Data Analyst Using Different Data Analysis Tools

Projects Completed: 1423
Ratings: ★★★★★ 4.9/5
Sample Power BI ProjectI am Benjamin, a dedicated data analyst leveraging different data analysis tools. Through my analysis, I will provide you with comprehensive insights which will make your decision making process easy.
My expertise spans a range of powerful data analysis tools and technologies including SPSS for statistical data analysis, Power BI, python for machine learning, R-statistics, SQL, Tableau, and Apache Spark. I will help you achieve your unique goals by providing customized solutions which address your needs.
Whether it is a machine learning project, predictive analysis, financial analysis, survey data analysis, data coding, data integration, data cleaning or visualization services, I will assist you as you focus on other important goals. Connect with me on Live Chat for free consultation.
A sample Data Analysis Project Using the Power BI Data Analysis Tool
Case Study: A Client wants to venture into the real estate business. However, he is skeptical owing that he doesn’t have real-time information that can help him navigate the real estate industry. He hires you as a data consultant to help him get some insights. Given that he is not well-versed with data analysis techniques; he just wants a simple report that he can use to make decisions before venturing into the business.
Here are the insights he wants to get:
- What is the sales trend in real estate over the years from 2001 – 2018?
- Which town(s) have the highest sales ratio regardless of the property type?
- Which property type(s) have the highest assessed value?
- On average what is the overall sales amount over the years?
You can access the data used in this project here.
The client needs only one dashboard that answers all these questions using the Power BI data analysis tool.
A Sample Solution of the Project Using Power BI Data Analysis tool (Dashboard)
Data Analysis Report Summary
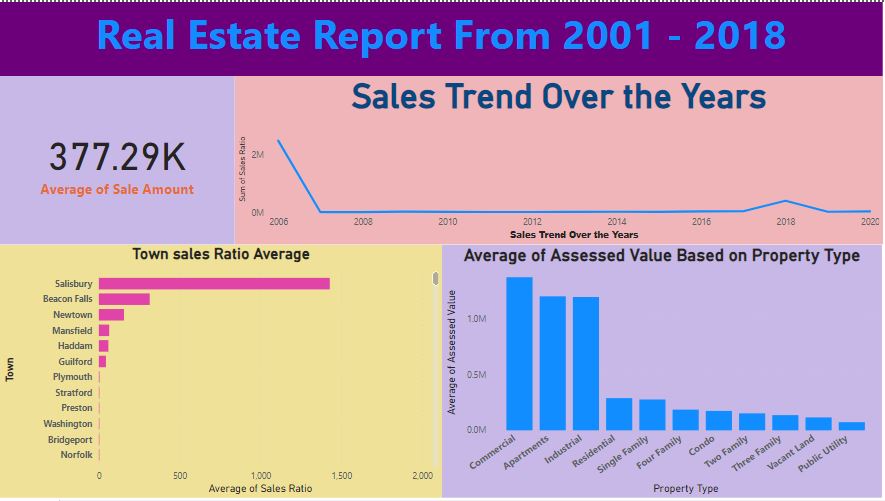
To effectively answer the questions of interest, the Power BI data analysis tool was used to create a dashboard. Based on the results, on average the overall sales amount over the years was 377.29K regardless of the property type.
The sales trend over the years has been declining. It was highest in the year 2006 and declined sharply from 2007 all the way to 2016. From 2017 it showed some upward trajectory. The projection of sales for the years 2019 and 2020 is that there will be declined sales overall.
Salisbury has the highest sales ratio followed by Beacon Falls, Newton, and Mansfield. From there, all other towns seem to have the same sales ratio on average which is relatively low.
The commercial property seems to have the highest assessed value followed by apartments, and Industrial. Vacant land and public utility have the least asset value.
Analyzing the Increasing Demand for different Data Analysis Tools
The current world has been dominated by pools of data. As such, businesses have turned this data into a powerful resource to help in making data-driven decisions. Researchers have not been left out either.
The USA Bureau of Labor reports that there will be an increased demand for data analysts by 25% between 2024 to 2030. Among the most important aspects of data analysis are the data analysis tools to be used.
The demand for different data analysis tools has also increased over time. Traditional tools still have a place in the current analysis space, and new analysis tools have been developed too.
Top 6 Data Analysis Tools Based on Their Demand
- R-Programming software: R is one of the leading data analytics tools in the market. It is used for statistical analysis, data modeling, machine learning, and predictive analysis.
- Tableau: This is a free open-source data analysis tool that can connect to different data sources. It is used for data visualization, mapping, and creating dashboards.
- Python software: Python is an object-oriented programming language that is easy to read, write, and maintain. Based on its ease of use, it has become one of the most popular data analysis tools in the industry. It is used for machine learning, data visualization, predictive analysis, and financial analysis among other analyses.
- Apache Spark: Developed by the University of California in 2009, Apache Spark is a data analysis tool that handles large data sets. It is loved for its fast memory processing. It is used for machine learning, data analysis, visualization, data cleaning, and financial analysis among other analyses.
- Excel: This is a popular analysis tool that is widely used across all industries. It has similar capabilities to all other analysis tools. Majorly, it is used for data cleaning, financial and statistical analysis, visualization, and technical calculations.
- Power BI: Microsoft Power BI data analysis tool is used specifically for data visualization, summarization, DAX, data mining, and data analysis.
The Most in demand Data Analysis Types
- Descriptive Analysis: It includes data summarization which describes the main features of a particular data set. This can be done using different data analysis tools like SPSS, Excel, R, Python, or SAS.
- Predictive Analysis: This type of analysis can be used to predict future trends using historical data. It is used for forecasting sales and customer behavior which then can be used to optimize resource allocation.
- Machine Learning: It involves the use of algorithms that help computers to learn from historical data and predict future events.
- Time Series Analysis: This analysis involves analyzing data based on time intervals.
- Spatial Analysis: This type of analysis involves the analysis of data that has some geographic components.
I am in the USA, will you Help Me with Data analysis?
Yes, regardless of your location in the USA, whether it be California, Florida, Michigan, Texas, Ohio, or any other state, we will help you achieve your goals through effective data analysis using different data analysis tools.
Physical location is not a problem since we operate remotely, though we are located in the USA.
How do I contact you to help with Data Analysis?
It is simple, contact us through our Live chat. An expert will respond in less than three minutes. You will get a free consultation on your project and decide on the data analysis tool you want to use with the expert. From there you will be guided on how to place your project and the expert will complete it.
How do I contact you to help with Data Analysis?
The project completion time depends on different factors. The scope of the project, the data analysis tool to use, the complexity of the project, and the availability of the expert are some of the factors that influence the project completion time.