SPSS Help Expert | Data Analyst | Data Coding | Reseacher

Projects Completed: 2751
Ratings: ★★★★★ 5/5
Sample of SPSS Analysis ProjectI am an experienced SPSS analyst. My goal is to help you get great insights for your data and make informed decisions may it be for research or business.
My expertise in SPSS covers a wide range of statistical analysis techniques including descriptive statistics, inferential analysis, regression, non-parametric and parametric tests, factor analysis, cluster analysis, ANOVA and ANCOVA, multivariate analysis, survival analysis, correlation, and more.
With a successful track record of completing more than 1000 projects in diverse industries and research fields, I have the experience you are looking for to make your project a success.
Let’s collaborate on Live Chat to offer you an SPSS help that suits your project perspective.
What is Statistical Package for Social Sciences (SPSS)?
Statistical Package for Social Sciences (SPSS) is a powerful software used in the field of social sciences and statistics. This software Package can manipulate data, perform complex statistical tests, and create informative graphs and charts. Regardless of whether you are a student working on a research project or a professional conducting data-driven decision-making, SPSS software can be a valuable resource.
As an SPSS enthusiast, I am here to help you. Whether you are facing challenges in analysis, data coding, statistical tests, or any type of SPSS help you may need, I am your go-to expert.
What SPSS Help Do You Offer?
My SPSS help cuts across all the areas of data analysis. I have a comprehensive package such that you don’t need to hire another SPSS help expert to tackle some project tasks that I did not do.
Below are some of the SPSS analysis and data cleaning services I offer.
- Data Preparation
- Cleaning and organizing datasets.
- Data transformation and recoding.
- Statistical Analysis
- Descriptive statistics.
- Hypothesis testing.
- Regression analysis.
- ANOVA and MANOVA.
- Interpretation
- Explaining results and statistical significance.
- Creating insightful data visualizations.
- Troubleshooting
- Resolving software-related issues.
- Debugging syntax errors.
How Long Does It Take to Complete an SPSS Project?
Each SPSS project has its specific needs. Therefore, the time taken to complete each project depends on the SPSS help needed for that particular scenario.
For example, for quick queries or troubleshooting, the assistance can be through Live Chat and be done immediately. However, complex tasks will take longer. It can take from one day to weeks depending on the project scope and the agreement with the expert.
However, when offering SPSS help, we prioritize quality services. Our goal is to meet your deadlines and ensure you receive quality work within the agreed time.
Don’t hesitate to Live Chat with Us to discuss your unique SPSS help inquiries and the project timeline.
What SPSS Data Analysis Techniques Do You Know?
I and other experts on our site have mastered different SPSS techniques to ensure that we offer unique SPSS help that meets your needs. These analysis techniques are used by researchers and analysts. Some of the common techniques are highlighted below.
- Descriptive Statistics: Summarize and present data with measures like mean, median, and standard deviation.
- T-tests and ANOVA: Evaluate group differences and test hypotheses about means.
- Regression Analysis: Understand relationships between variables and predict outcomes.
- Chi-Square Test: Determine associations between categorical variables.
- Factor Analysis: Identify underlying patterns in data.
- Cluster Analysis: Group similar cases or objects together.
- Correlation Analysis: Assess relationships between two continuous variables.
- Non-parametric Tests: Analyze data when assumptions of parametric tests are not met.
These are just some of the common SPSS analysis techniques. However, if you need real SPSS help for any analysis, you can live chat me for customized assistance.
What Is Hypothesis Testing in SPSS (Statistical Data Analysis)
Hypothesis testing is a very important statistical process and also an important concept in research. Using the concept of hypothesis testing, you can evaluate assumptions and draw conclusions from a given data set.
Example:
Imagine you have a drug that you want to test for its impact on patient outcomes. In this scenario, you would develop two hypotheses: the null and alternative hypotheses. The null hypothesis assumes no effect, while the alternative hypothesis is accepted if the null hypothesis is rejected.
o H0: The drug has no effect
o H1: The drug has an impact
After developing the hypotheses, you utilize different statistical analyses in SPSS to test them. Typically, the significance level of the tests is set at a 0.05 confidence interval.
I will offer SPSS help with hypothesis testing and drawing conclusions from the analysis results. This will ensure that your research is viable and its deductions are logical.
What are the Most Common Mistakes when Doing SPSS Data Analysis?
There are many mistakes you can make when conducting analysis using the SPSS software. With my SPSS help service, I will ensure that we eliminate the possibility of these mistakes happening. Some of the most common mistakes include;
- Incomplete Data: Neglecting to handle missing data appropriately can lead to biased results.
- Failure to Check Assumptions: Not verifying assumptions for statistical tests can result in inaccurate conclusions.
- Incorrect Variable Types: Using the wrong variable types (e.g., nominal instead of ordinal) can affect analyses.
- Overlooking Data Transformation: Failing to transform data when necessary can lead to non-normal distributions or heteroscedasticity.
- Misinterpretation of Output: Misunderstanding statistical output or not checking effect sizes can lead to incorrect interpretations.
- P-Hacking: Conducting multiple tests without correction increases the risk of Type I errors.
- Ignoring Outliers: Outliers should be addressed as they can distort results.
- Lack of Documentation: Not documenting analysis steps and decisions can hinder reproducibility.
AfroResearch Inc. SPSS Help Services
AfroResearch Inc. is a company specializing in statistical analysis. Among the different services offered by the experts of the company is SPSS help.
We offer a wide range of SPSS help services, including data preparation, statistical analysis, interpretation, troubleshooting, customized training, and report/presentation creation. Our commitment to efficiency ensures timely support for your projects.
Let’s get in touch and make your SPSS project a success through our expert data analysis service. Live Chat with us today for assistance.
A Sample SPSS Project Based on a Given Case Study
Case Study: A health expert has collected data from females of different ages. He wants to analyze this data and use it to make a general conclusion about the health patterns of females in that locality. Among the variables he recorded are age, height, weight, pulse, systolic, diastolic, cholesterol levels, and body mass index. To help him make logical decisions, the expert has to answer the following questions.
- What is the average age, weight, pulse, sys, dias, chol, and BMI?
- Is there a correlation between age and Pulse Rate?
- What is the distribution of the BMI and what does it say?
- Does age affect the weight of the population?
The clinical officer has hired an SPSS expert to help him in analyzing the data and making recommendations.
A Sample Solution of the Case Study
The Average age, weight, pulse, sys, dias, chol, and BMI.
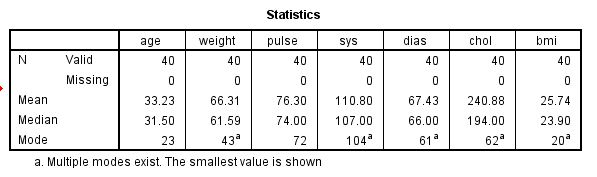
The mean age of the population was 33 years with a mode of 23 years. This is an indication that on average, the participants were adults. Also, the average weight was 66 Kgs with a pulse rate of 76 on average, and sys, dias (110, 67), cholesterol level of (mean = 240), and BMI of 25. By general analysis, these statistics show a relatively healthy population.
Is there a correlation between age and Pulse Rate?
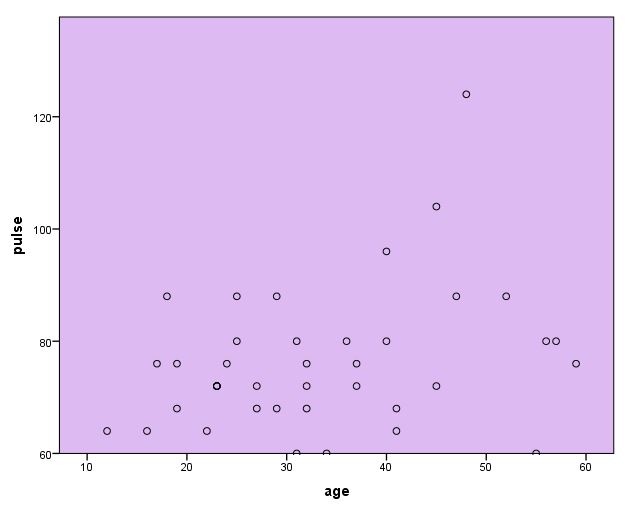
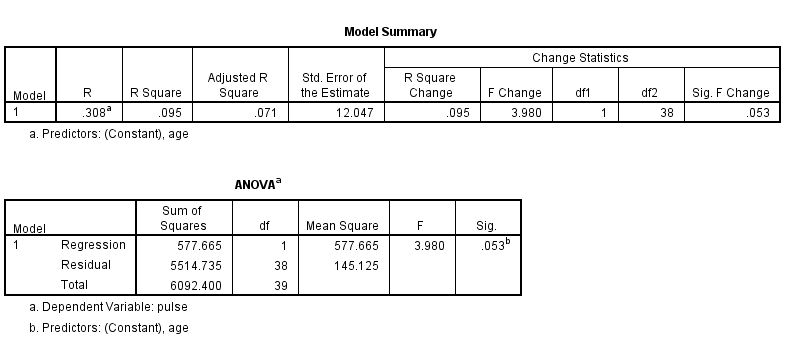
To estimate the correlation between age and pulse rate, a scatter plot was used. However, the scatter plot showed no statistically significant relationship between the two. Further analysis was done to evaluate the claims. Based on correlation and regression analysis, the test yielded non-significant results. At 95% CI, the model results were F (1, 38) = 3.980, P = 0.53. These non-significant results show that age cannot be used to predict the pulse rate of the population.
The Distribution of the BMI
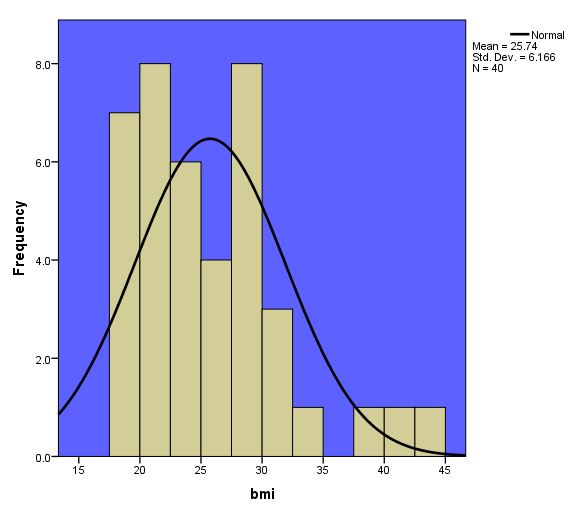
The Average BMI was 25.74 which is relatively high. Also, it is skewed to the left indicating those who have an average BMI of 25 and low are the majority. The normal BMI is 18.4 to 24.9. As such, the 25.74 is an indication of an overweight population.
Does Age Affect the Weight Distribution?
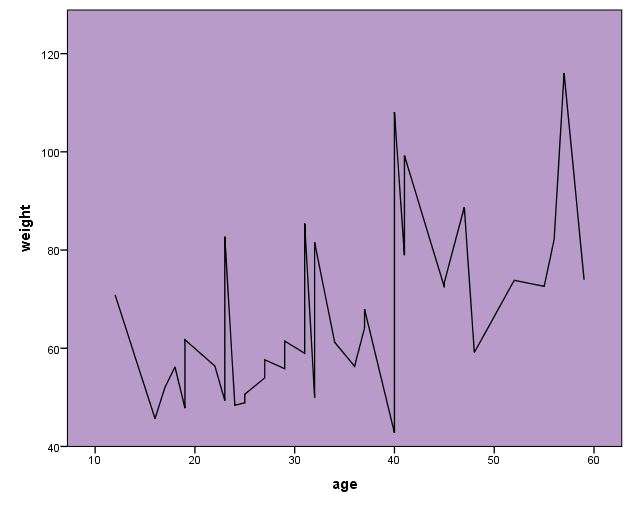
Based on the line graph distribution, there is no relationship between age and Weight. This means a young adult can be overweight and an old one has the normal weight.